One in a Row
August 11, 2022
It was only a few years ago that inflation reports would go virtually unnoticed. Nowadays, they receive “breaking news” headlines, live news coverage, and follow-up press conferences at the White House.
July’s inflation report (published August 10, 2022) was yet another hotly awaited release. The key question at hand – are things getting worse or are they starting to get better when it comes to inflation?

Fortunately, there was some encouraging data in the release to indicate that things have stopped getting worse and are in fact getting better (at least for this month). So much so that one headline I read said we now have a “One in a Row” positive inflation print.
Yes, a streak of one is not very impressive – but every streak starts with just one in a row. And this one print was very encouraging. The market took this CPI reading as great news – with the read-thru being that cooling inflation will allow the Federal Reserve to slow down rate increases at the next meeting (and in the future) – and markets were up considerably on the day of the release.
Will the Fed react and change/moderate its course? There is a lot of time (and a lot of data) between now and the next Fed decision in September so we won’t pretend to know that answer. For now, all we can do is digest the data of the latest report.
Here are the highlights for you:
The Consumer Price Index (or CPI) climbed 8.5% year over year – slower than expected and a cooling off from the 9.1% increase year over year as of June 2022. After removing food and energy (which is another common metric), that increase was 5.9% year over year.
The monthly increase (ie: June 2022 to July 2022) was 0% – another encouraging sign and the best month over month print since May 2020.
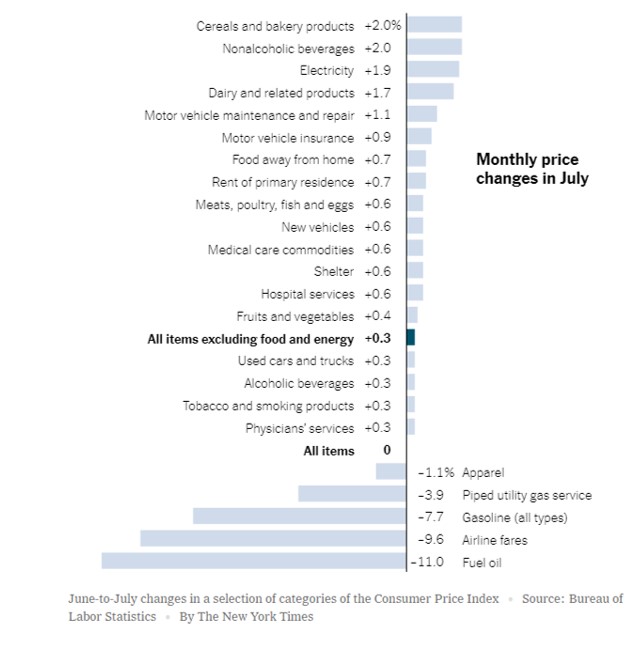
Here’s a look at the monthly components and their respective contributions. As you can see, increases in major areas (such as food and shelter) was offset by declines in other material areas (mainly gasoline and oil, which had carryon impacts to other items such as jet fuel and airfares)

Wednesday’s CPI news was followed on Thursday August 11, 2022 by another monthly inflation release, the Producer Price Index (or PPI). The PPI measures the average change over time in the selling prices received by domestic producers for their output. PPI generally reflects supply conditions in the economy.
While PPI rose 9.8% year over year in July 2022, it declined by 0.5% from June to July 2022 – the first monthly decline since April 2020.
What do these reading mean for you and your portfolio? Remember – as we always say, when it comes to markets, better/worse matters far more than good/bad. This played out this week as markets rose on news that these readings were getting better – even though the actual levels remain “bad” by historical standards.
Will these trends continue and will inflation continue to get better? Will this “better” trend in data cause the Fed to retreat? Will this “better” data allow consumers and businesses to endure this growth slowdown and allow the US economy to avoid a recession? Will our streak of one in a row extend to a streak of many in a row?
As always, the answers to these questions are unknowable. All we can do is keep moving thru our investing journey, armed with the data we can observe and our understanding of past cycles.
The future and the answers to these questions will be here before we know it. In the meantime, onward we go.

Note: All commentary above is as of the date of this post and is for education and informational purposes only. Windermere and its principals do not intend for this to serve as investment advice and are not responsible for any actions taken based on this article. Consult your financial advisor before taking any actions as it relates to your own investment portfolio
Leave a Reply
You must be logged in to post a comment.
Leave a note