Client question: Bears, corrections, recessions, oh my!
May 26, 2022

If you turn on any news channel or read any news publication these days, odds are you will hear at least one or more financial term that immediately raises your blood pressure. Words such as correction, bear market, and recession are definitely front and center. A client recently asked what these terms mean – and whether they should be worried that they are dominating the narrative.
Let’s examine each of them a bit more closely
1.) Correction
Definition: Consensus deems a correction to have occurred when a major stock index, such as the S&P 500 or Dow Jones Industrial Average declines by more than 10% (but less than 20%) from its most recent peak
How should I think about it: While downward moves never feel good, corrections are a normal part of the long term compounding of wealth. The name is derived from the concept that such declines “corrects” market excesses and euphoria and returns prices to their longer-term trend. As investors, a market tied to fundamentals and logic is easier to navigate over the long term
Picture is worth a 1,000 words
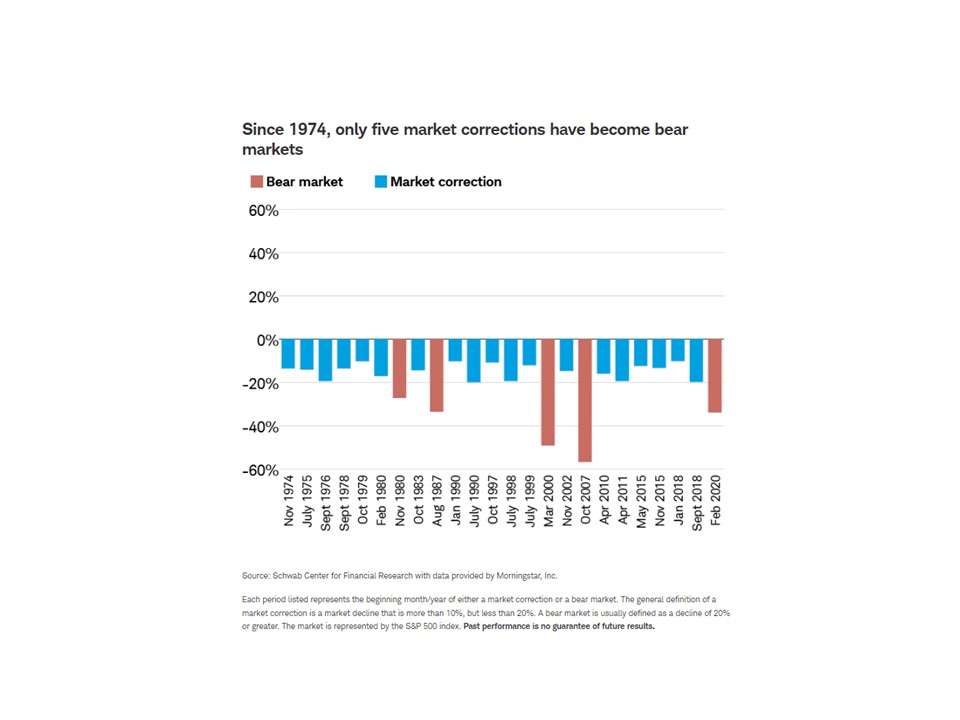
The below chart shows that 24 corrections have occurred from November 1974 thru 2020 – and also shows that only five of them fell into bear market territory (discussed next)

2.) Bear Market
Definition: The next level past a correction, measured as a decline from the most recent peak of 20% or more in a major index
How should I think about it:
Nothing lasts forever, including bull markets (which is the calming and peaceful time between bear markets that we have all become accustomed too). The economy and markets have always – and will always – move in cycles. As a result, it is not a matter of if, but rather a matter of when, we will have a bear market. While they are challenging to endure and can seem as if they will last forever, it’s important to consider history and the clear conclusion that every bear market has been followed by a bull market, returning us to new highs. It has always just been a matter of time
Picture is worth a 1,000 words:
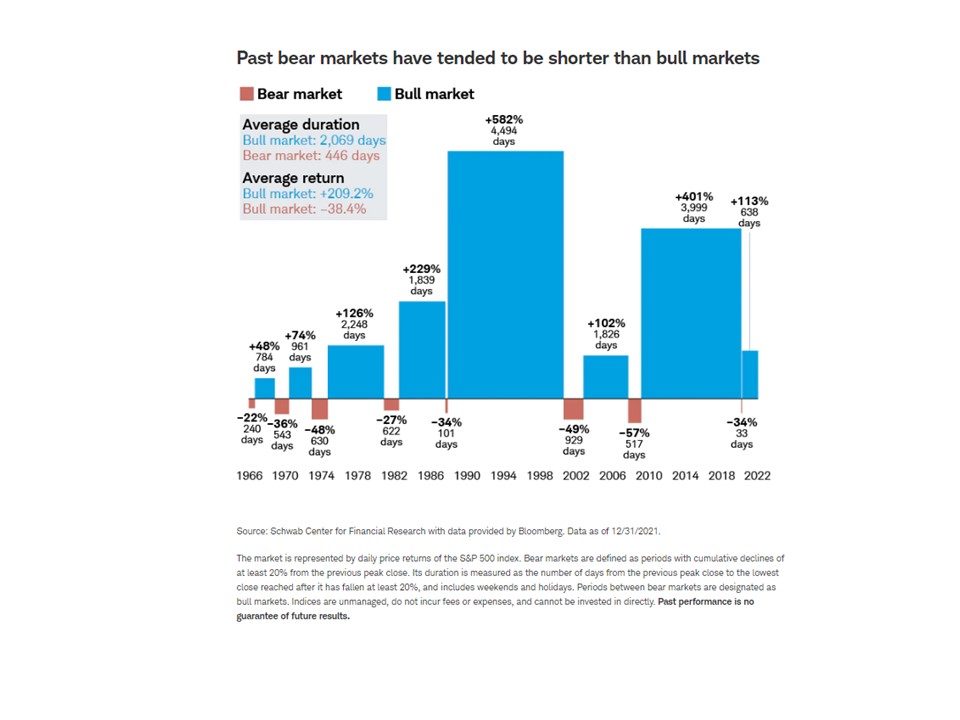
I always say that stocks take the stairs up and the elevator down. Said another way, they seem to go up far more slowly than they fall. This graph illustrates that point and shows that the bear markets tend to be far shorter than the calm period (bull markets) in between

3.) Recession
Definition: Despite the prevailing narrative, a recession is not (and has never been) defined as two consecutive quarters of negative GDP growth.
The official arbiter of US recessions is the National Bureau of Economic Research (NBER), which defines recession as “a significant decline in economic activity that is spread across the economy and that lasts more than a few months.”
The four primary items that the NBER looks at to determine whether the United States is in a recession are—not coincidentally—the four indicators that make up The Conference Board’s Coincident Economic Index (CEI):
- real personal income less transfer payments;
- nonfarm payroll employment;
- wholesale and retail sales;
- and industrial production.
The CEI tends to track the business cycle in real time, peaking at the start of recessions and finding a trough at the end of them.
How should I think about it:
Much like bear markets, recessions are not a matter of it but when. They are often presented as a cataclysmic event but in reality, they are the naturally recurring final stage of every economic cycle. The recessionary phase allows the excesses to be eliminated, thereby making way for a new cycle to begin on sounder footing.
The rhetoric has picked up around the likelihood of a recession in recent months, as the Federal Reserve has started to raise interest rates in an effort to slow down spending and combat inflation and wage pressure. There is a potential that inflation slows while other parts of the economy move along just fine – employment stays steady, wages moderate, growth remains supportive, earnings hold, etc. However, should those other factors tip downwards, a recession may become increasingly likely.
Much like corrections and bear markets, recessions are going to happen. You do not need to fear them. You simply need to endure them.
Picture is worth a 1,000 words
At any point, and especially with a possible recession on the horizon, looking at trends in the underlying economic data can be helpful. The Leading Economic Indicators from the Conference Board combine several factors that often move in advance of a business cycle. When looking at this data (and most other data for that matter), the trend (ie “better or worse”) matters far more than the level (ie “good or bad”).
This chart shows where the Leading Economic Indicators, as well as the Coincident Economic Indicators, stood as of April 15, 2022. As you can see, while the CEI (ie: what is used to mark a recession) had been hanging in there, there was some noticeable weakening trends in LEI

Note: You can see how this chart looked during other recessions here
I appreciate that these terms (and their increasing frequency) can be confusing and alarming. However, it’s important to note that we’ve been here before and we will most likely be here again. Like I always say, your financial life is a journey. Keep putting one foot in front of the other – and this too shall pass
Note: Above commentary as of publish date shown for blog post. All comments herein represent the opinions of Windermere and its principals. It is for educational and information purposes only and should not be relied upon as investment advice. Please consult your financial advisor as it relates to your own investments and financial planning
Leave a note
Leave a Reply
You must be logged in to post a comment.
This was written do well, if I understood it. 😊 Also liked the goat picture. I have that one framed.
Good job.