Client Question: S&P 500 Index
August 2, 2023
For the past two weeks, I’ve addressed client questions related to two popular equity market indexes – the NASDAQ and the Dow Jones Industrial Average. While no none asked me specifically about the seemingly most popular equity index, I couldn’t leave this series of questions without addressing it. So let’s take a closer look at (you guessed it) the S&P 500 index.

As noted in the last two posts, market indexes are used as a way for market participants to track the market’s progress and to benchmark/compare their own performance. They’re also used as a way for investors to easily “buy” large swaths of the market as countless investment products such as exchange traded funds and index mutual funds are structured and pegged to these indexes. The S&P 500 is perhaps the most widely-used and tracked index for the US equity market, with an estimated $16 trillion dollars pegged to the index.
When was it created?
The history of the index goes back to early 1900s, when Poor’s Publishing and Standard Statistics Company merged to form Standard & Poor’s. In 1957, the company expanded their pre-existing index to include 500 companies and named it the S&P 500 Stock Composite index.
How is it comprised and calculated?
The S&P 500 is a free-float weighted/market capitalization index. Each constituent is weighted by its market capitalization (outstanding shares * price per share). The “free float” adjustment removes any closely-held shares (such as those held by insiders, government, or royalty) from the weighting. In the US, insider shares are typically the only float adjustment but this methodology allows for the S&P 500 methodology to align more closely with other economies around the world (where royalty and government shares can also play a role).
A committee selects the companies that are included in the index based on a variety of criteria including market cap, liquidity, listing exchange, % of revenue based in the US, and others.
Can the constituents change?
Yes. The index is rebalanced quarterly and at times, certain names are added/removed.
What companies are in the index?
The index contains 500 leading businesses that represent approximately 80% of the available US stock market capitalization. The current top ten constituents as of July 31, 2023 are: Apple, Microsoft, Amazon, Nvidia, Alphabet A shares, Tesla, Meta, Google C shares, Berkshire Hathaway, and United Health Care
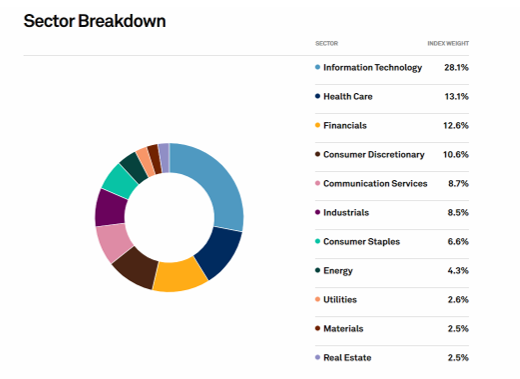
What is the sector composition of the S&P 500?
The S&P 500 index is made up for constituents covering 11 sectors. Here is a graph of the current sector breakdown as of July 31, 2023 – with technology representing the greatest weighting and real estate and materials tied for the lowest

Should I monitor this index?
Given the history of the index and its ever-present nature in market coverage, many view this index as a key barometer of the market and the economy. Much like the DJIA, it is often the index quoted in news stories and headlines.
However, as noted in prior index discussions, for investors that are focused on other specific areas of the market – such as technology companies as an example – may find more relevance in other indexes such as the NASDAQ. Or those looking for a read on blue-chip/stable American businesses, the DJIA may be of more use.
In short, there is no harm on following a variety of indexes. Just be sure to understand what the index measures and how it’s comprised so you can understand the relevance and correlation it has to your own portfolio.
Leave a note