

Client Question: What Do Feelings Have to Do With It?
September 23, 2026
As equity markets continue to march higher, sentiment is getting increasingly negative. A client asked about this apparent contradiction and what investor sentiment surveys typically mean for the path forward.

Hard versus Soft Data
If you’re an engaged investor, you are probably used to following economic data (like interest rates, inflation data, trade data, etc) and company-specific data (like earnings and forecasts). Such data is often called “hard data” as they are specific numerical metrics you can track and measure. However, you may be less familiar with so called “soft data” – data that attempts to monitor attitudes about markets and investing. While some soft data focuses on consumers, there are two soft data sets that focus on the current thinking and “feelings” of investors – the Fear & Greed Index and the Bull versus Bear survey. Let’s look at what each one measures and where it stands currently
Fear & Greed Index
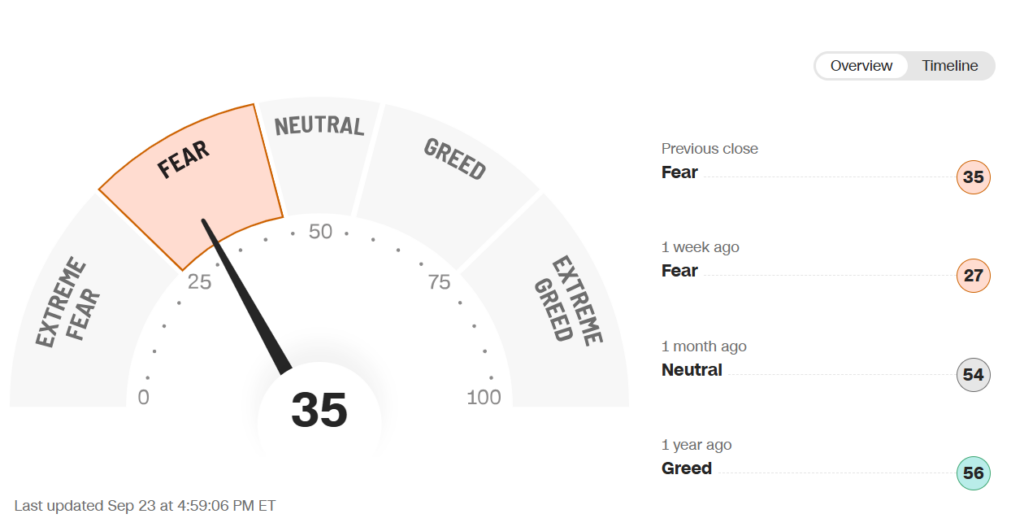
CNN developed this tool over 10 years ago to measure how much these two fundamental human emotions are shaping markets. The index goes from zero to 100, with zero indicating extreme fear and 100 showing extreme greed. The index is calculated using several different data sets include 125 day moving average of S&P 500, the number of stocks making 52-week highs, 52 week lows, market breadth, the put/call ratio, volatility, demand for so-called “safe-haven” assets like bonds, and demand for less safe assets like high-yield bonds. This tends to be a volatile index and can move considerably week to week. As a result, it tends to be more useful to look at the trends or when it reaches extremes.
Where are we right now in this equation? The index is tilted to Fear – an increase in negative sentiment from a month ago (when things were neutral)
AAII Bull versus Bear
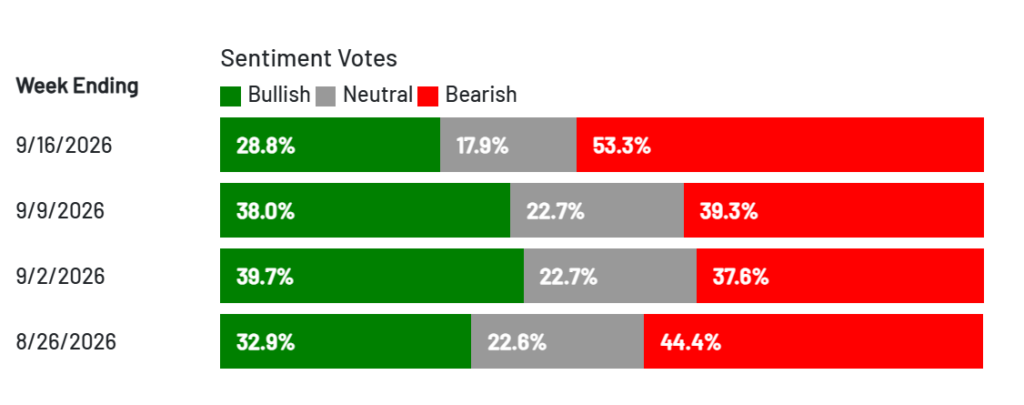
Every week, the American Association of Individual Investors (AAII) surveys investors for their thoughts on where the market is headed over the next six months. It’s a simple measurement of how many are bullish and how many are bearish. This too can move around week to week, so it tends to be more useful to look at trends. Historically, the averages are 38% bullish, 31% bearish, and 31% neutral.
As of the week of 9.16.2026, bearish views (ie: negative on the markets) are outpacing bullish feelings (ie: positive on markets). This bullish weighting has been on the rise in September. There are of course many reasons for investors to be concerned (such as sudden spike in interest rates, ongoing geopolitical conflicts, ongoing trade war, upcoming election, etc).
Impact on Markets
While no trend is guaranteed to repeat in the future, in general, these two surveys may indicate the likely path of markets in the near future. For both of them, the more negative the survey results are (ie: fear > greed and bearish > bulls), the better forward market performance tends to be in the future. This may seems counterintuitive but it does tend to hold. It’s worth keeping an eye on these metrics moving forward. There is certainly a lot of be worried about in markets today (see list above – and add your own worries). However, always remember that markets move on “better vs worse” and not “good versus bad” – so even if investors are justified in some negative feelings, if trends are better than expected, things may just work out in investors’ favor.

Leave a note