Give me a K!
June 27, 2024

As the first half of 2024 comes to a close, I keep hearing this cheer in my head as the letter K is once serving as the perfect depiction of the current market dynamics.
Loyal readers may remember references to the letter K during the COVID years (I know, let’s not revisit those years right?!) Nonetheless, this letter served as a clear illustration of the vast differences between things that were working (the upper slant of the K) and things that were not working (the lower slant of the K) at that time. Back in 2020, the upper K included items such as work/play from home stocks (like Zoom and Peloton) and cleaning product companies (like Clorox) and the lower K included items like travel stocks (airlines, cruise lines, and hotels) and live event/gathering places (restaurants and concert promoters). Funny to think how many of those items have swapped positions since then (good lesson to remember).
Fast forward four (very interesting and active) years, and we once again find ourselves in a time period characterized by extreme bifurcation. Here is my attempt at illustrating a few of these “splits” in the markets (each of which I discuss in more detail below)
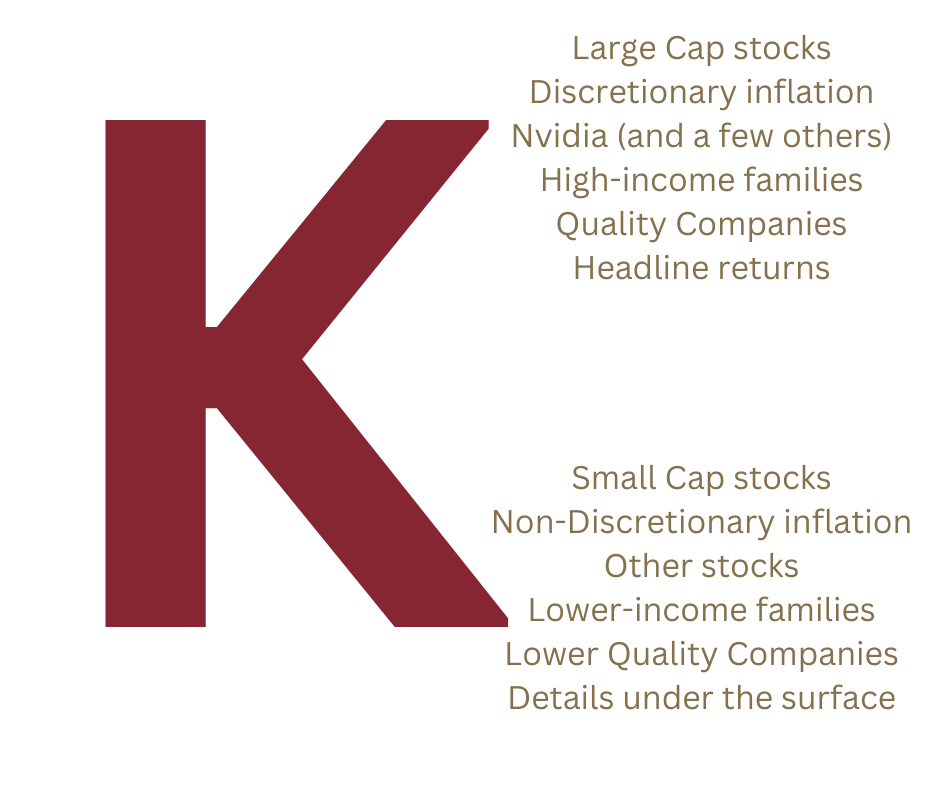
Large cap > small cap
Large market capitalization companies continue to dominate and “win” the year in 2024, outpacing small caps by 30% since the start of this most recent bull market (October 2022). This is unusual as smaller cap companies tend to lead at the start of a bull market – but this time period has been anything but routine! It’s also important to note that persistently higher interest rates have proven to be a far stronger headwind for smaller companies vs. large, having a real impact on cash flows and income for smaller cap companies. If rates start to decline, certain small caps may begin to show signs of life
Discretionary inflation trends > non discretionary inflation trends
Inflation has been front and center since the pandemic. Progress is being made in bringing inflation down but it’s bifurcated. Inflation in discretionary items (like household goods, appliances, and clothing) has come down sharply (almost moving into a deflationary position). However, prices on non-discretionary items (like health care, car insurance, and shelter) have continued to climb (up 6% in aggregate). Consistently higher prices in areas that consumers can’t avoid/pass on is putting continuing pressure on the economy.
Life for high-income families > life for low income families
Wealth inequality has been a persistent challenge in the US. Sadly, this year has caused that gap to widen even further. While wages have risen across most income strata, the increases are higher on the top end of the income range (benefiting higher earners more). Further, given the dynamics in inflation noted above, inflation is hitting lower income families harder as a larger percentage of their income goes to non-discretionary items that have stayed at elevated levels. Lastly, higher-income families are also more likely to benefit from strong returns in equity markets, increases interest income on cash reserves, and historically low fixed mortgage rates (as they tend to a larger percentage of home ownership)
Nvidia + a few more companies >. all the rest
For the past few years, there had been reference to the Magnificent 7 stocks of the S&P 500 (Apple, Amazon, Alphabet, Meta, Microsoft, Nvidia, and Tesla). In 2024, as performance in these names has been mixed, media now references the Fab Four (Amazon, Meta, Nvidia, and Microsoft) and quite honestly, it could be the Outstanding One with Nvidia far outpacing the others with a year-to-date return of 155%.
Quality companies > lower quality companies
As noted above, large cap companies have outpaced smaller companies. Within large cap, there has been some dispersion as well, notably quality companies (those characterized by high levels of free cash flow and profitability and low debt) have been strongly outpacing lower quality companies, with 13% higher returns thus far in 2024. Combined pressures of higher interest burden and lower earnings growth will continue to put pressure on lower quality cohort for the foreseeable future
Headline returns > details under the surface
I’ll end with the most stunning split this year in my view – the variance between the strength in the headline returns and the weakness beneath the surface. This is best shown by this chart from Schwab’s Liz Ann Sonders (she publishes this almost every day on X) which compares the max drawdown at the index level compared to the max drawdown of constituents within the index.
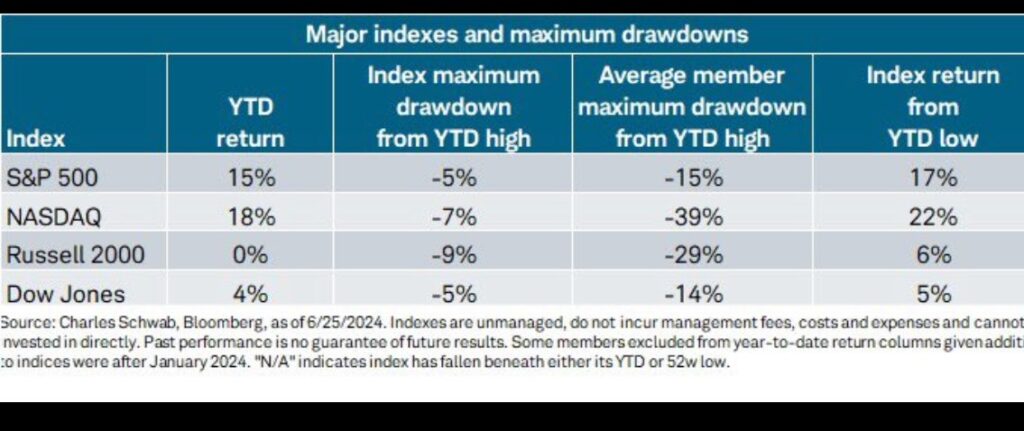
Clearly, not all companies are doing well and a few standouts are pulling up the averages. The worry is always that the strong performers trade down and the indexes start to decline as well. Fortunately, the top names have done exceptionally well but it remains a risk worth monitoring as we move into the final half of the year
As illustrated above (thanks once again to the letter K), it has been a bifurcated year on multiple levels. All in all, the economy, markets, and well-balanced portfolios (or those focused on the winning names and/or sectors) have done relatively well. Investors are likely to be very pleased with YTD returns far outpacing expectations and historical norms. However, there remains some concerning data beneath the surface that warrants attention as we enter the third quarter and beyond. As always, I’m excited to see what comes next!
Onward we go,

Leave a note