Time in vs Timing
April 18, 2024
I was listening to a webcast from one of our mutual fund managers this week, and he touched on one of my favorite mantras – time in the market matters more than timing the market.

After a few weeks of market volatility and considerable micro and macro news, I thought it was worth sharing this excellent reminder with all of you.
The topic came up on the call in order to address a question the portfolio manager had been hearing with great frequency during Q1 2024 – as markets moved higher and kept hitting all-time highs – “how can you suggest investing in the equity markets when they are hitting all time highs and are clearly too expensive?”
His answer (one I have repeated myself throughout my career) – The reason you can invest at all price levels – the consistent outperformance of “time in” the market versus various “timing” strategies.
Let’s look at the first chart he shared. This chart shows the appreciation of the S&P 500 over the past 50 years (in blue). New all time highs are marked in green (all 163 of them).
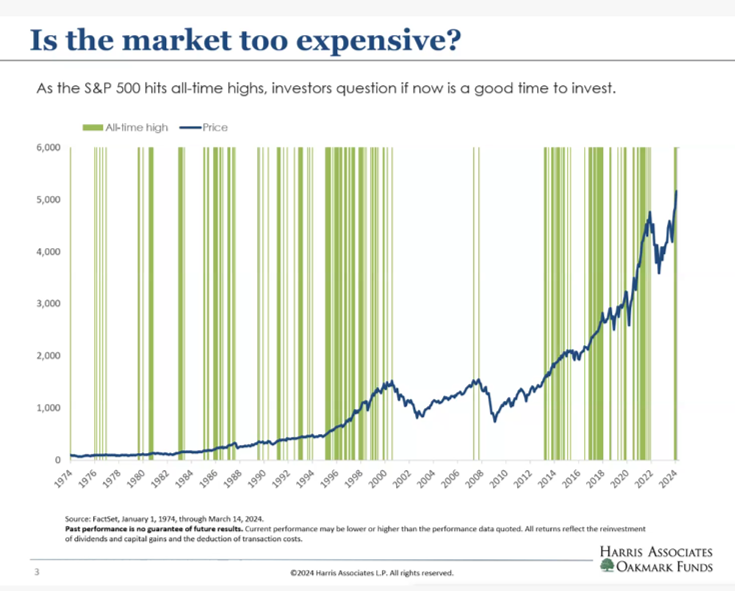
What do you observe in this chart? First, it’s clear what the long-run trendline of the S&P 500 is (up and to the right). Second, there are quite often declines in value after an all-time high is reached. If you focus on that second fact, you may start to think that a sound approach to investing could be to wait for an all-time high, then sell, and then attempt to get back in before the next upward trend. I’m sure you can guess how that turns out but let’s look at the numbers (which the manager and his firm kindly compiled for us)
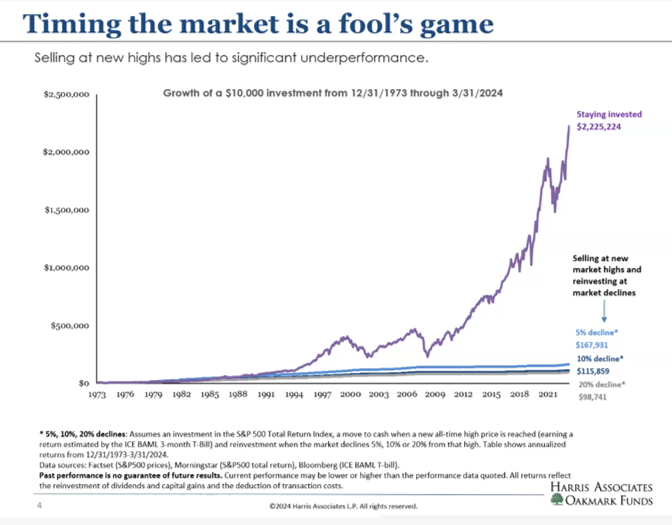
This second chart shows the growth of a $10,000 investment from 1973 thru 3/31/2024. There are three “timing” strategies illustrated: all involve selling at each new market high (going to cash) and buying back in after a 5%, 10%, and 20% decline from those highs. Those strategies would have turned the $10,000 into $167,931, $115,859, and $98,741 respectively. Not awful- all amounts are higher than $10,000. Yet look at what would happen if you did nothing but put in the time – noting the all time highs as they were hit, watching the declines, staying patient, trusting the process, and ultimately doing nothing. Your $10,000 would be worth $2.23 million.
When you have a week like we’ve had – one where you are questioning your approach and whether or not you need to “do something” or “get out” now that an all-time high has come and gone – just take a breath and take a look at these historical charts. Of course, this time could always be different, but for 50 years, time in has proven to be a winning approach.
Onward we go,

Leave a note