Client Question: Sectors
May 12, 2022
During a quarterly review meeting recently, a client asked why we include a schedule showing the sector weighting of their portfolio versus the sector weighting of the S&P 500. It was a great question and one I thought was worth diving into this week.
First, a few definitions:
S&P 500 index – this is a commonly referenced US equity index, which captures the aggregate level of the 500 top US public companies (as measured by market cap). There are countless other indices that splice and divide the US public markets in varying ways – however, the S&P 500 is one of the most referenced and as a result, it’s the one we capture in our sector reporting
Sector – every public company is assigned to a sector (or category) that share similar business activities, products and services, or characteristics. There are 11 in the US stock market (listed in descending order as of April 30, 2022) :
Technology
Health Care
Consumer Discretionary
Financial
Communication Services
Industrials
Consumer Staples
Energy
Real Estate
Utilities
Materials
(For more information on each sector, scroll to bottom of screen here)
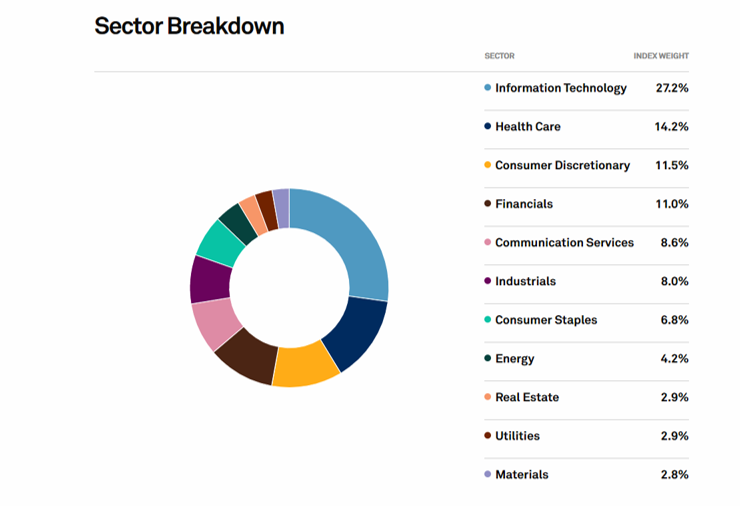
S&P 500 sector weighting – represents the percentage of the index (ie: how many of the ~500 companies in the index that do business in each sector). Here is a graph of the latest allocation as of April 30, 2022
Portfolio sector weighting – our software analyzes all holdings (both equities as well as mutual funds and ETFs) and determines what percentages are allocated to each sector. You can complete your own analysis or there are publicly available tools that can help (such as Morningstar.com and tools offered by the various custodians on their websites)
Knowing the above definitions, why is it useful to analyze sector allocation? We find a few main uses/benefits:
1.) Position portfolio – there are many options in investing today that allow you to “track the index” either via ETFs or mutual funds designed to do just that. However, as active managers, we look to outperform indexes and one way to do attempt to achieve that is to overweight (ie: own more) or underweight (ie: own less) relative to the index. Looking at our sector weights allows us to make those strategic decisions – although this is of course just one tool we use in designing portfolios
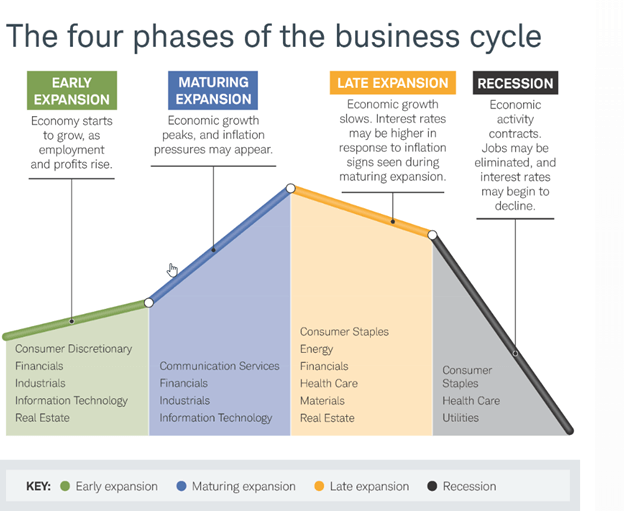
2.) Business cycle stage – each sector has historically benefited from various portions of the business cycle. Of course, there are always exceptions but examining sectors against a business cycle background can prove insightful over time
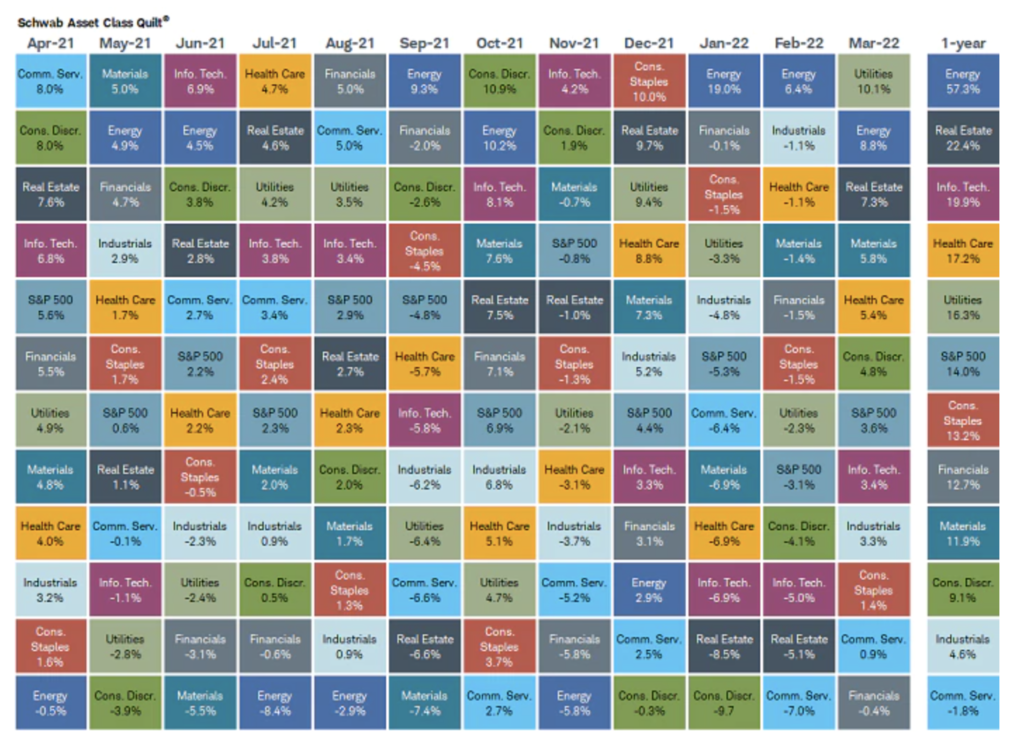
3.) Ensure diversification – depending on a whole host of variables, certain sectors will inevitably outperform others. Predicting exactly who will lead during any month, quarter, year, or decade can be challenging – so a sector review can help you verify that you have exposure to a variety of varying businesses that will react differently to the ever-changing world. The below graph shows the performance of each sector from April ’21 – March ’22 – don’t let the picture overwhelm you – just follow the colors horizontally and you will see any given sector can flip from best to worst month to month. Therefore, owning a slip of each can prove effective
As with any portfolio analysis tool, sector analysis can’t stand in isolation. There are limitations to sector analysis (as there are with any other standalone spreadsheet or chart). In today’s market, we believe that you have to look at ALL the characteristics of a business – not just one, such as its sector. With so many economic and market variables, we are far more focused on fundamentals and factors (such as cash flow, debt levels, margins, earnings growth, upwards earnings revisions, etc) than we are with what slice of the pie chart a company falls within. And of course, any bottoms-up research (ie: company specific) needs to be done in context with top-down assessments (ie: broad economic and macro factors)
We will continue to evaluate our portfolios sector weighting and compare that against the weighting of the S&P 500 index. However, rest assured, that is just one of many analyses we are completing and assessing as we navigate today’s markets.
Until next week,
Pam
Note: All commentary above is as of the date of this post and is for education and informational purposes only. Windermere and its principals do not intend for this to serve as investment advice and are not responsible for any actions taken based on this article. Consult your financial advisor before taking any actions as it relates to your own investment portfolio.
Leave a Reply
You must be logged in to post a comment.
Leave a note