Client Question: Tariff Math(?)
April 3, 2025
If you watched the Rose Garden ceremony on April 2nd, you will undoubtedly remember this visual aid used to illustrate the so-called reciprocal tariffs set to be imposed by the US. Here is a sampling of the data shared.
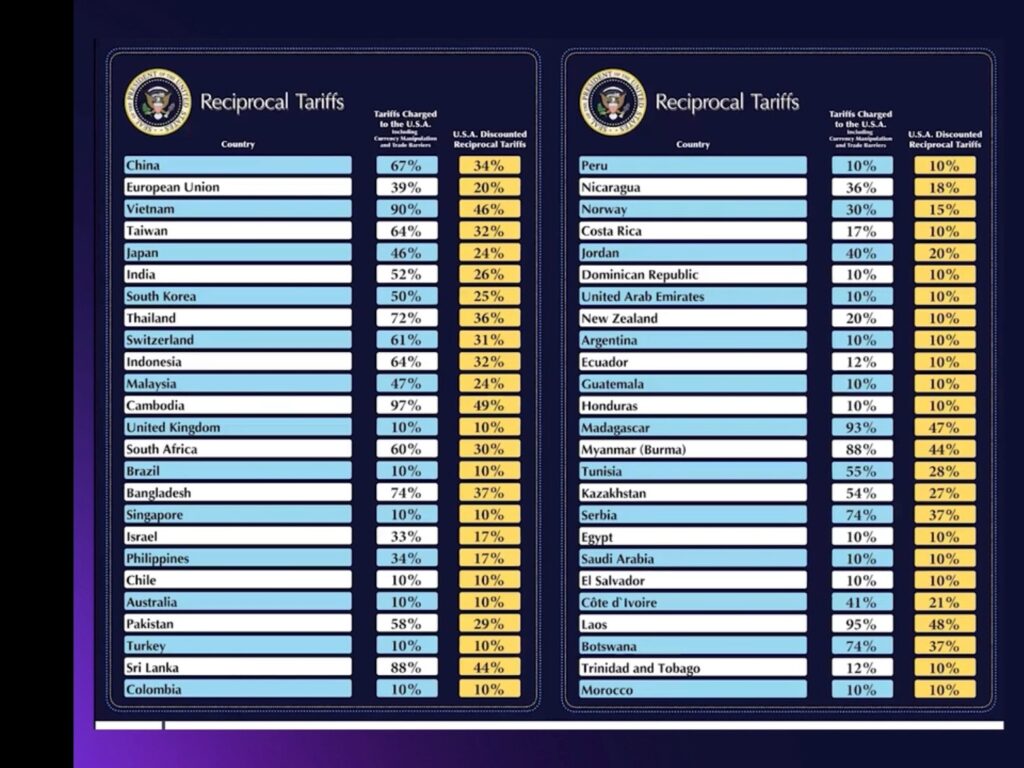
The concept was clear – the administration calculated the tariff being charged to the USA by its trading partners and applied a 50% rate to that amount (with a floor of 10%)
I, like many others, immediately questioned the “math” of the Tariffs Charged to the USA column, as did a client I talked to after the event. The numbers were so high in some instances that they almost seemed made up. And there was no explanation given for how the amounts were calculated during the press conference.
Upon further research that night, it turns out the figures aren’t “made up” per se. However, they do not represent actual tariffs being charged by these countries, nor some average of those tariffs being charged. Rather, they are calculated using a rather unorthodoxed formula to measure trade imbalances.
The formula is:
Country’s trade deficit with the US (goods only) /Country’s Exports to the US (goods only) = “tariff charged to USA”
Let’s look at a few examples:
EU: $235.6 billion surplus/$605.8 billion exports = 39% claimed tariffs charged
Indonesia: $17.9 billion surplus/$28.1 billion exports = 64% claimed tariffs charged
Vietnam: $123.5 billion surplus/$136.6 billion exports = 90% claimed tariffs charged
A few hours after the Liberation Day event, many news reports were revealing the likely calculation and the White House did eventually acknowledge the underlying formula and stated the figures were not actual tariffs being charged to the US.
Given that these “tariffs charged to the USA” are the numbers used for the 50% reciprocal tariff calculation, it’s important to understand the nature by which they were calculated. There are a few other key facts to keep top of mind:
*These are not reciprocal tariffs. If they were, the US would be looking at the actual tariff rate being charged by its trading partners (Europe around 2.7% average, Japan around 1.9% average). That is not what is being used – and as a result, calling them reciprocal is inaccurate
*The calculations do not include services – they only include goods. It’s no secret that the US economy is a services-based economy and the US exports more services that it imports. Ignoring that essential element of trade in these calculations – which are being used to set tariffs rates – seemingly ignores an important consideration element and makes these ratios far worse than they would be if services were considered. Perhaps this will be adjusted in the negotiation process – time will tell
*This formula focused on trade deficits. But keep in mind – trade deficits are not inherently bad. They can simply result from America’s outsized spending power as well as the geographical availability of goods or the allocation of American resources to their highest and best use. If America buys more goods from Japan than Japan buys from America, is that instantly a negative? Not necessarily. To determine that, you would want to understand if making the imported goods locally would be the highest and best use of American resources or why we American has to import (perhaps goods can only be found/made in that country). But the “formula” being used automatically assumes trade deficit = bad and must be remedied. Again, this may be considered in negotiations but for now, that’s the read thru
*It’s important to understand what is happening in the case where the US has a trade surplus with a country (like Australia for instance). They are receiving a 10% minimum tariff.
Uncertainty, volatility, and some level of self-imposed chaos is upon us – for sure in the near term and it remains unclear how long it will persist. It’s more important than ever to stay diligent and do your own research and thinking. Nothing – not even a column on a presidential visual aid – can be taken at face value
Leave a note