Latest Inflation Reading – Closer Look
July 14, 2022
Inflation is the top issue on investors and consumers’ minds these days. I thought it would be worth taking a closer look at the latest reading – and how future readings may play out.
If you’ve read any news headline over the past 48 hours, you already know that June’s inflation reading (as measured by the Consumer Price Index) was not good news. The year over year increase was 9.1%, ahead of the expected 8.8%. However, as is usually the case with markets and economic data, it’s important to dive a little deeper and see what is going on beneath the surface.
Let’s take a look at the top 20 contributors to the year over year increase.
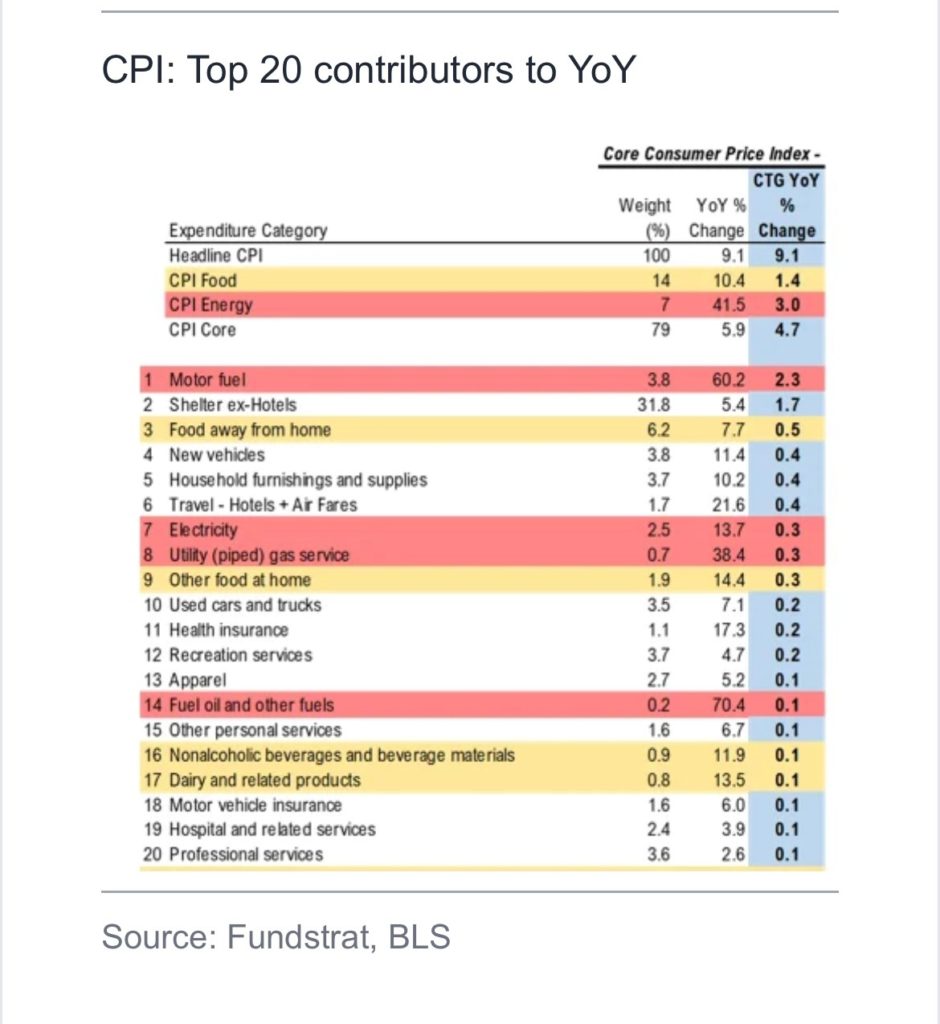
The clear leader – motor fuel, which made up 2.3% of the 9.1% YoY change. Beyond adding to CPI, it also greatly influences consumers perceptions of inflation as it’s such a part of every day life and is so visible (gas stations on every corner).
Seeing this, you may not realize that energy prices themselves have in fact come down over 25% in recent weeks and have even returned to levels in place prior to Russia’s invasion of Ukraine. So why haven’t gas prices rolled over yet?
A study recently shared by FSInsight notes that gas prices lag changes in oil prices by approximately one month. As a result, there is a strong potential that gas prices will be strongly deflationary in next month’s print.
Could this trend carry thru to some of the other categories? Based on the observable data – yes. Here are some highlights, again as obtained from an FSInsight research note. Again, changes in the actual CPI data will lag these measures
- used car prices falling at fastest pace since early 2000s
- retailers record inventory glut and hiring liquidators
- energy commodities down >25% and oil <$95 and gasoline down 25 days straight
- homebuying demand hit a wall, new rental rates slowing
- even airfares and hotel rates are rolling over hard (based on data obtained from Hopper)
- indeed.com labs shows material decline in job openings
- literally, leading indicators for >75% of CPI components are showing big rollovers
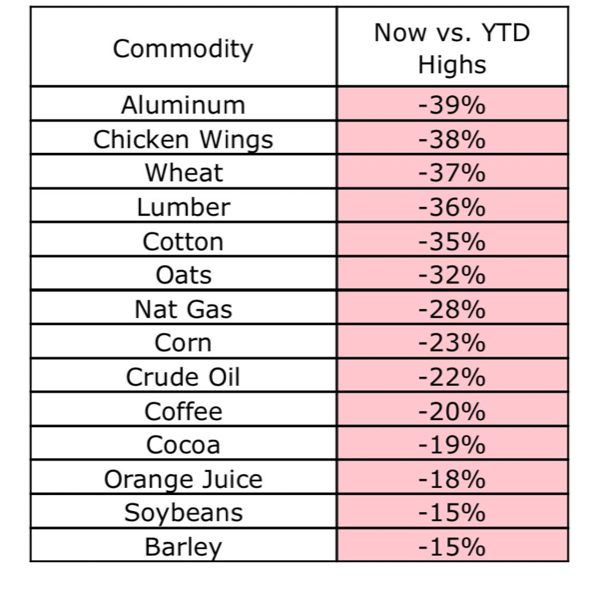
Here is another chart of deflationary signs (source: Bloomberg)
Always remember – as we have said before and will say again – markets care more about trends (ie: better or worse) than they do about levels (ie: good or bad). As a result, any signals that inflation has stopped getting worse and is indeed getting better will be a very welcome occurrence. And it may be here before sooner than you think.
Invest on,

Note: All commentary above is as of the date of this post and is for education and informational purposes only. Windermere and its principals do not intend for this to serve as investment advice and are not responsible for any actions taken based on this article. Consult your financial advisor before taking any actions as it relates to your own investment portfolio
Leave a Reply
You must be logged in to post a comment.
Leave a note