Should I Stay or Should I Go Now?
October 6, 2022
No, this isn’t a sing-along to the classic 80’s song but rather a question that I’m sure many investors (perhaps yourself included) find themselves asking after another rough quarter.

Markets had a tumultuous end to Q3, as rates rose and equities sold off (read more about that dynamic in this week’s client question). In combination to earlier weakness in the year, investors are feeling the pain of negative returns across almost every asset class. See this chart for detailed returns by asset class
With all that said, it’s no wonder investors are trying to figure out whether they are better off selling while they can. Why would someone be tempted to do this? Turn on the news or read any article and you will find a multitude of justifications – many of which will sound reasonable. Stubbornly high inflation, ongoing conflict between Russia and Ukraine, strong US dollar, recession inevitable, corporate earnings sure to decline…and many others
While the cadence of the “reasons to sell” may be elevated as pessimism hits records highs, the very presence of such negative messaging isn’t new. To illustrate this point, I discovered this chart earlier this week published by Brian Feroldi on twitter. Zoom in – and you will see all of the many “smart-sounding reasons” there have been to sell investments since 1950
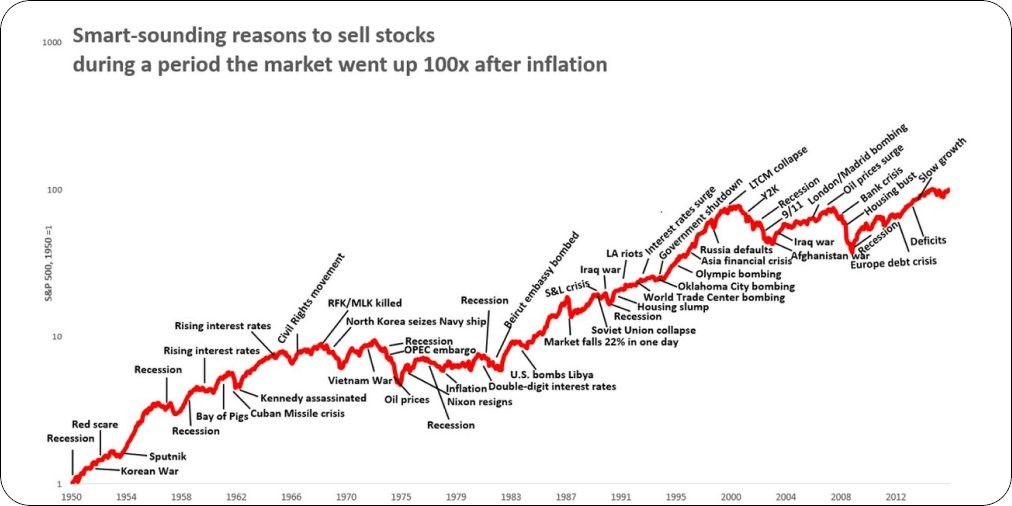
I didn’t count them but there are sure a lot listed. Notice anything else? Zoom out a bit. Now do you see it? You got it – look at the ultimate trajectory of the red line. During the time all those reasons appeared – over and over again, the market rose 100x. Not in a straight line. Not all the time. Not all at once. Not necessarily in any particular 1, 3, or 5 year period. But cumulatively, over time – 100x.
By no means am I saying the reasons to sell aren’t important or valid. They certainly are and should be given their due weighting. But it is just as important to consider the ultimate reason to stay – the long term compounding of wealth.
Let’s look at a recent example. Last week, the drumbeat of consensus on financial news media was to sell equities and perhaps consider buying the 2-year treasury that was yielding `4%. (Side note: This strategy was so widely recognized the Treasury Department reported outages on the Treasury Direct website where you buy such bonds. )
In the first 3 trading days of Q4, the equity markets (measured by the S&P 500) have risen 5.5%. In three days, the S&P 500 index earned more 2 year treasury will earn in a year.
Yes, I realize that three days does not make a trend. Yes, I know fixed income (like the 2 year) is a part (not the whole) of an investment strategy. Yes, I realize these gains are after major losses for equities year to date. Yes, I realize there in ongoing risk and potential for more declines. Yes, I understand it it hard to watch the declines. Yes, I know there are reasons to sell.
But I also know the enduring trend of invested capital is up and to the right.
Always lots of reasons to go – but one constant reminder to stay right where we are.
Onward we go,

Note: All commentary above is as of the date of this post and is for education and informational purposes only. Windermere and its principals do not intend for this to serve as investment advice and are not responsible for any actions taken based on this article. Consult your financial advisor before taking any actions as it relates to your own investment portfolio
Leave a Reply
You must be logged in to post a comment.
Leave a note