Who Else is Ready for “May Flowers?”
May 1, 2025
As the old adage goes, “April showers bring May flowers.” For investors, it sure felt like it was storming/raining most of the month of April – so let’s hope some sunnier/happier times lie ahead for us in May and beyond

Let’s take a look at a few key events from the stormy month of April
Markets Fall – and Recover
Liberation Day (April 2) brought a swift sell off in equity markets – and a delayed – but equally stunning – rise in 10-year treasury yields. Throughout the month, markets did their level best to recover as the tariffs were walked back and put on a 90-day pause (accompanied by a softer tone from government officials)
The S&P 500 was down 11.2% for the month on April 8th – and ended the month down just 0.8%. The below chart shows that whipsaw action (and that of other key indexes)
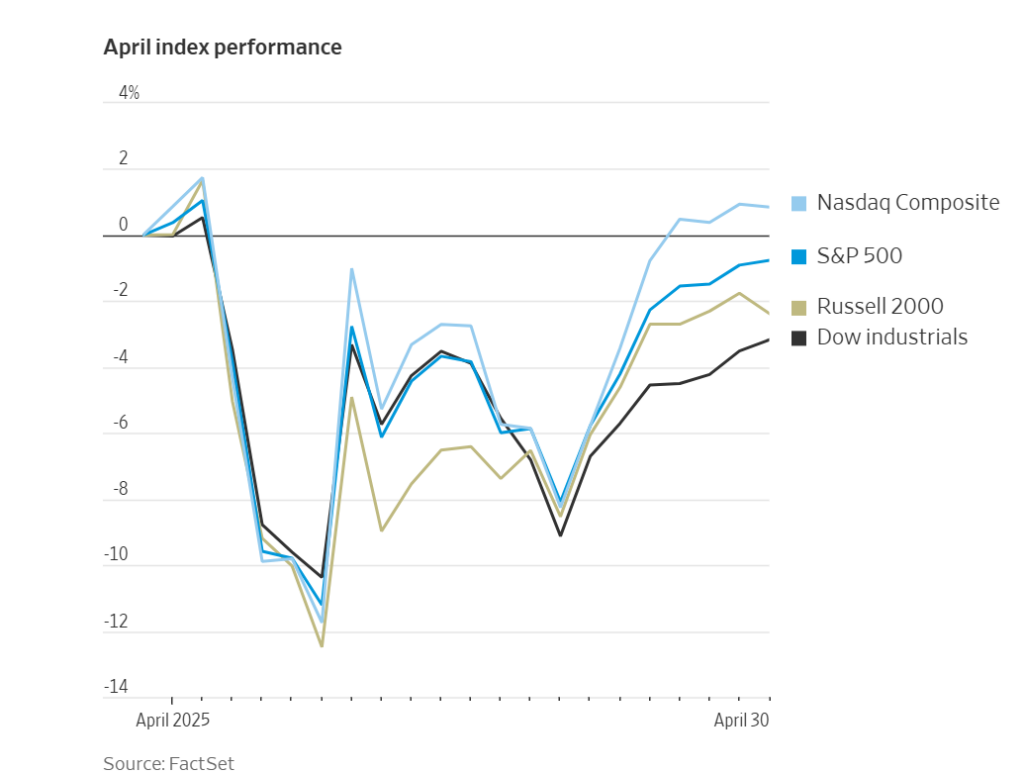
Interest rates were also volatile, as the US 10-year rate started the month at 4.25%, fell initially on the tariff news to 3.91%, rose to as high as 4.59% intraday and ended the month at 4.17%
Investor Sentiment Remains Low
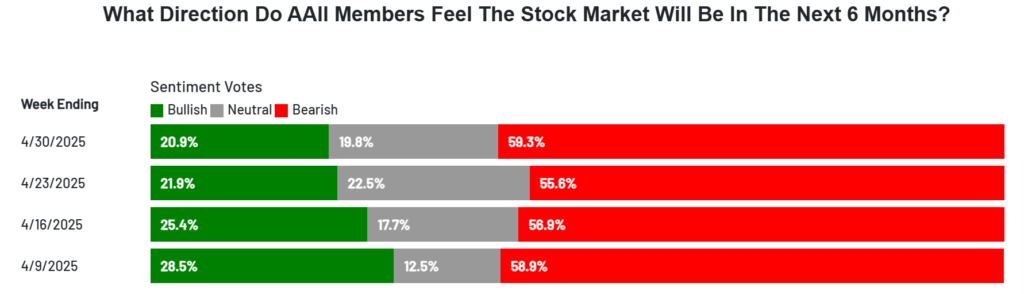
Even though markets recovered the worst of their losses during the month, investor sentiment remains low and has fallen steadily during the month as shown by this AAII bulls (positive on market) and bears (negative on market) survey data.
US Growth Slows
US Gross Domestic Product (“GDP”) fell at a 0.3% annual rate in the first quarter of 2025, the first contraction since 2022, according to the release by the Commerce Department. If you recall from a recent post, GDP is comprised of four components added together:
*Personal Consumption Expenditures – also called consumer spending, this is the goods and services people buy, such as clothing, groceries, health care, cellphone services, etc.
*Investment – This is business spending on capital expenditures/fixed assets, such as land, buildings, and equipment as well as investment in unsold inventory. This category also picks up the purchase of homes by consumers
*Government Spending – As the name implies, this represents spending by federal, state, and local governments
*Net Exports – US exports minus US imports
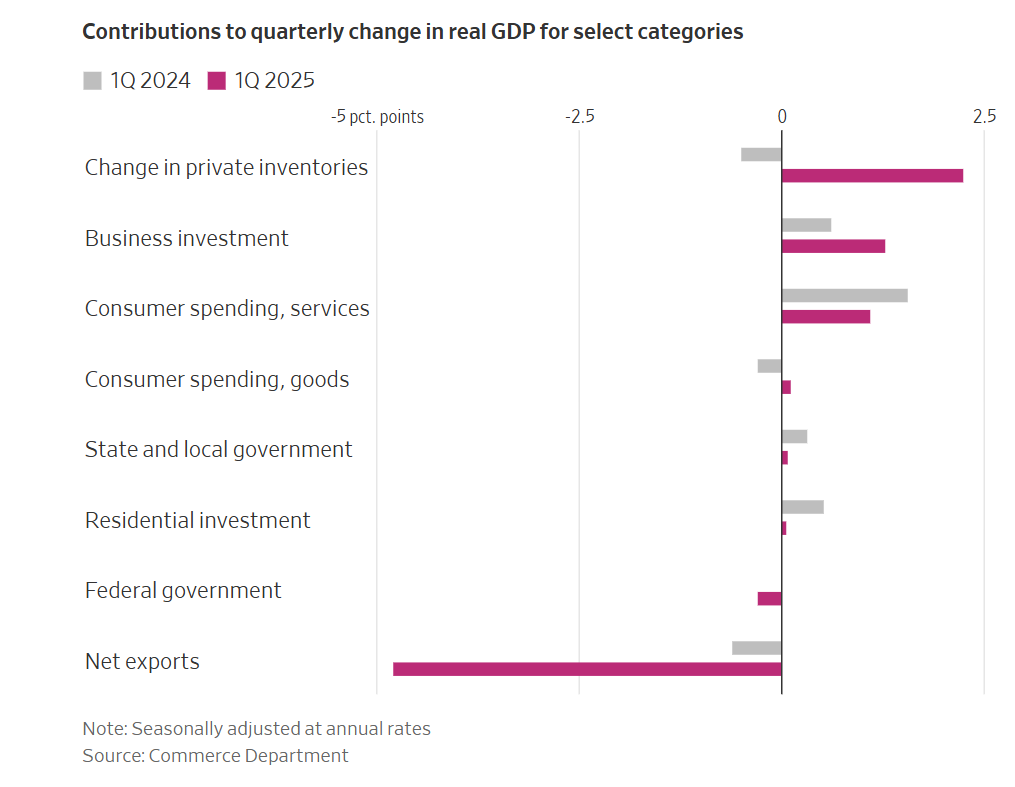
As you can see in the chart below from the WSJ, the largest driver of the negative net results for GDP was a sharp decline in Net Exports. This was driven by the anticipation of tariffs and companies/consumers rushing to import goods ahead of that policy change.
Earnings Hold Their Own
April also brought Q1 2025 earnings season. While these are admittedly backward looking, the results (and commentary) have been encouraging to markets. As of this writing, 57% of companies have reported with 77% beating expectations. Earnings estimates are a bit trickier, with some companies giving two sets of guidance (with and without prolonged tariffs) and many estimates trending lower for Q2 given the policy backdrop. However, surprisingly, other key metrics (like cap ex spending from the hyper scalers in AI) remain on trend and have not been revised downward. Overall, earnings (and estimates given) have been more positive than initially anticipated.
Fed’s Mandate
The Federal Reserve has been a hot topic during the month as it continues to hold rates steady (even in the face of “encouragement” by the administration to lower rates). There has been positive signs on both the inflation and job market – but the uncertainty of the path forward due to “strategic uncertainty” (the term being used by the Administration to describe the ongoing tariff negotiations) is keeping the Fed on hold – for now.
Re: inflation, the latest reading was Core PCE (the Fed’s preferred measure) which was released for March. It fell to 2.6%, the lowest level since March 2021.
Weekly jobless claims were higher than anticipated (as released on May 1). There is some noise in the number as there was a 15,000 jump in the state of New York (which accounted for more than the entire national increase). This is a likely due to the fact that teachers in New York can apply for unemployment during summer months and is likely not indicative of a national job slowdown. So while the headline jobless claims number can be a leading indicator of weakness, this number did reveal a troubling trend (yet)
****
After a volatile month like April, it’s fair to wonder if there are brighter days ahead (are “May Flowers” in store for us?) The future is always impossible to predict but it seems even more challenging in the face of the driving forces behind this volatility (namely policy uncertainty where the outcomes are being driven by a few minds).
The concern now, in my view, is whether the current tariffs and the resulting decline in consumer and business confidence may be putting a pause/halt on spending. In a consumer driven economy like America, a pause in spending – if it’s prolonged enough – can quickly cause growth to slow and may result in a recession (see this week’s Client Question post).
There is still time for this to be averted and/or lessened in my opinion. As noted above, large US companies this week (like Google and Meta Platforms) reaffirmed their spending plans and as we know from history, you underestimate the spending capacity of the American consumer at your own risk. Further, while there had been a slowdown in shipping containers at major ports, we are seeing that pick up once again and reports that major retailers have resumed shipments. However, if there isn’t clarity on trade deals in the near future, we may not be able to avoid the inevitable result of a growth slowdown from these sudden policy shocks. Note: Next week I plan to write about the various types of recessions and what impact that may have for investors (which may not as bad as you may be fearing).
As we close out April, I think there are three items that are useful for every investor to consider:
1.) Evaluate your risk tolerance – We’ve all had very real and valid reaction to the events of the past few weeks. There is no better way to test your risk tolerance (and appropriateness of your asset allocation) than by living thru a risk event. If you had immense trouble dealing with this time – to the extent your quality of life and peace of mind were deeply impacted and you were tempted to abandon your plan – it may be worth revisiting your allocation now and making adjustments to help you weather the next stormy period that much better. Remember, the plan you want is one you are able to stand behind, even when the worst case scenario materializes
2.) Remember this example – April was a masterclass of why “stay the course” continues to be sound (albeit repetitive) investment advice. As noted above, US equity markets were down over 10% on the month at one point – and proceeded to end the month almost flat. See above charts for the wild swings. Missing one or two days in April would have crushed your longer term returns. It’s impossible to know when these days will come – so it’s best to just be “in” for all the days
3.) Build the Arc Now – We are by no means past this current market obstacle – and there could be another one ahead (and another after that…). The future has always been uncertain and will remain so. Not to overplay this analogy, but we may not get flowers in May – we could see even more showers. As markets have come back and YTD returns are not overly negative as of today, now is a perfect time to shore things up if needed. In addition to asset allocation evaluation discussed above, take the time to evaluate your cash reserves and your spending levels and make adjustments now. It’s always easier to think logically before the storm picks up again.
May is wonderful month in Wisconsin – a time when grass and plants come back to life, daylight stretches out, the temperatures start to warm, and life just feels a little bit easier and more enjoyable. I hope the same goes for your hometown (wherever this finds you) and that markets give us their fair share of springtime joy as well.
Onward we go,

Leave a note